POC live output30 minutes of broadcast video.
30 minutes of broadcast video.
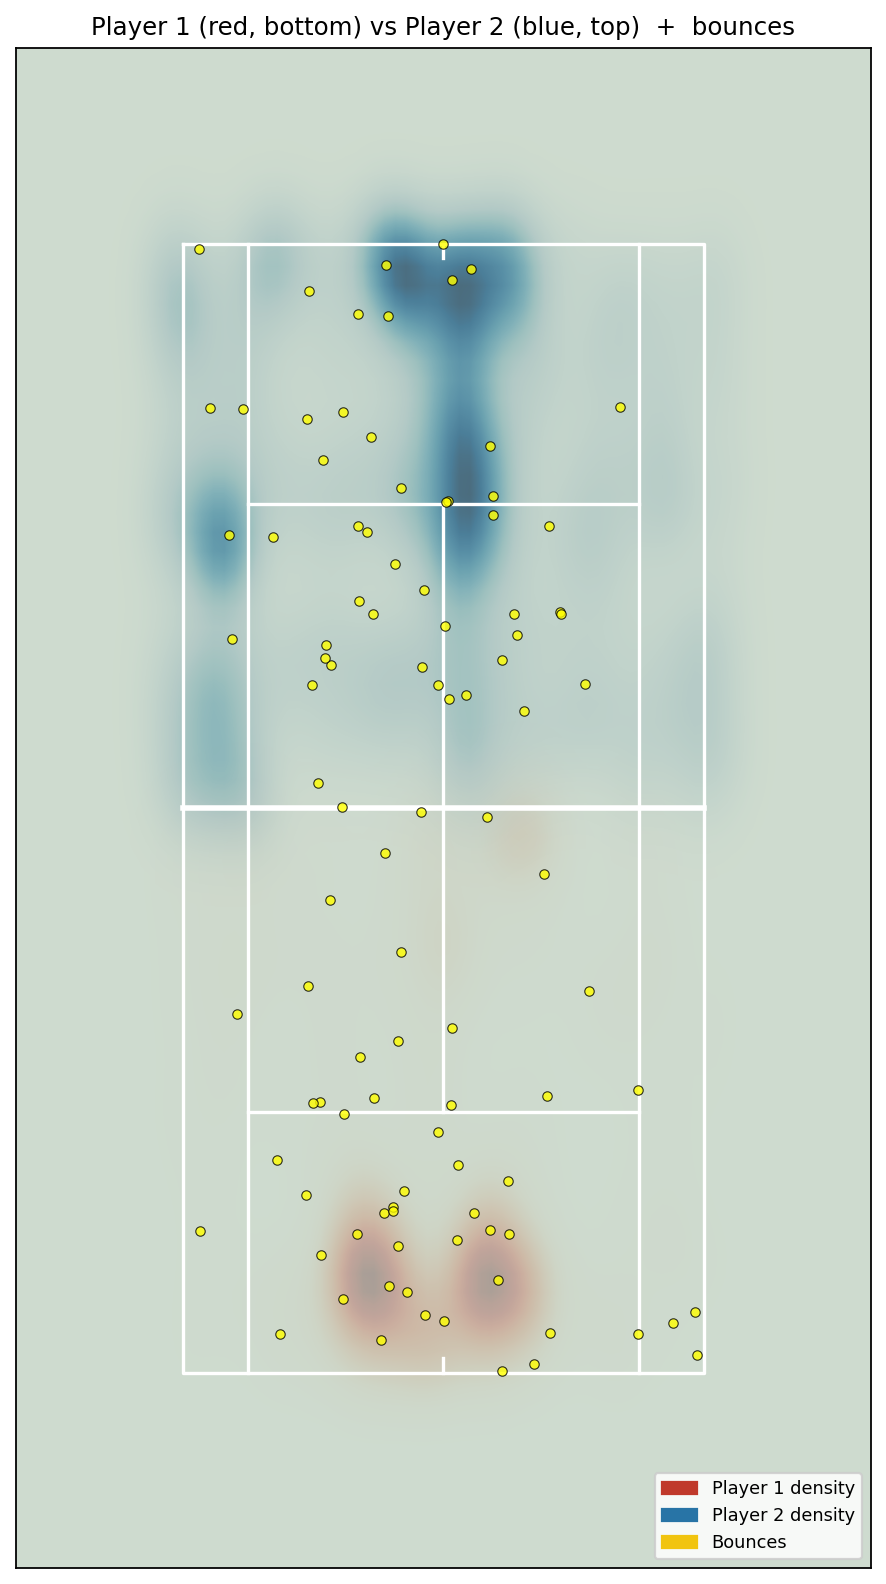
Spatial tennis insights, extracted automatically.
On a Van Assche · Skatov sample (Oeiras Challenger), the system tracked both players with 90%+ coverage, generated court-position heatmaps, identified player-side movement patterns, and produced coach-safe spatial summaries.
30 min of match analyzed39 points detected18.1 min of point windowsPlayer coverage 97.7% / 90.7%ReID 57/60Winner committed 86.5%
🇫🇷
Court bottomVan Assche
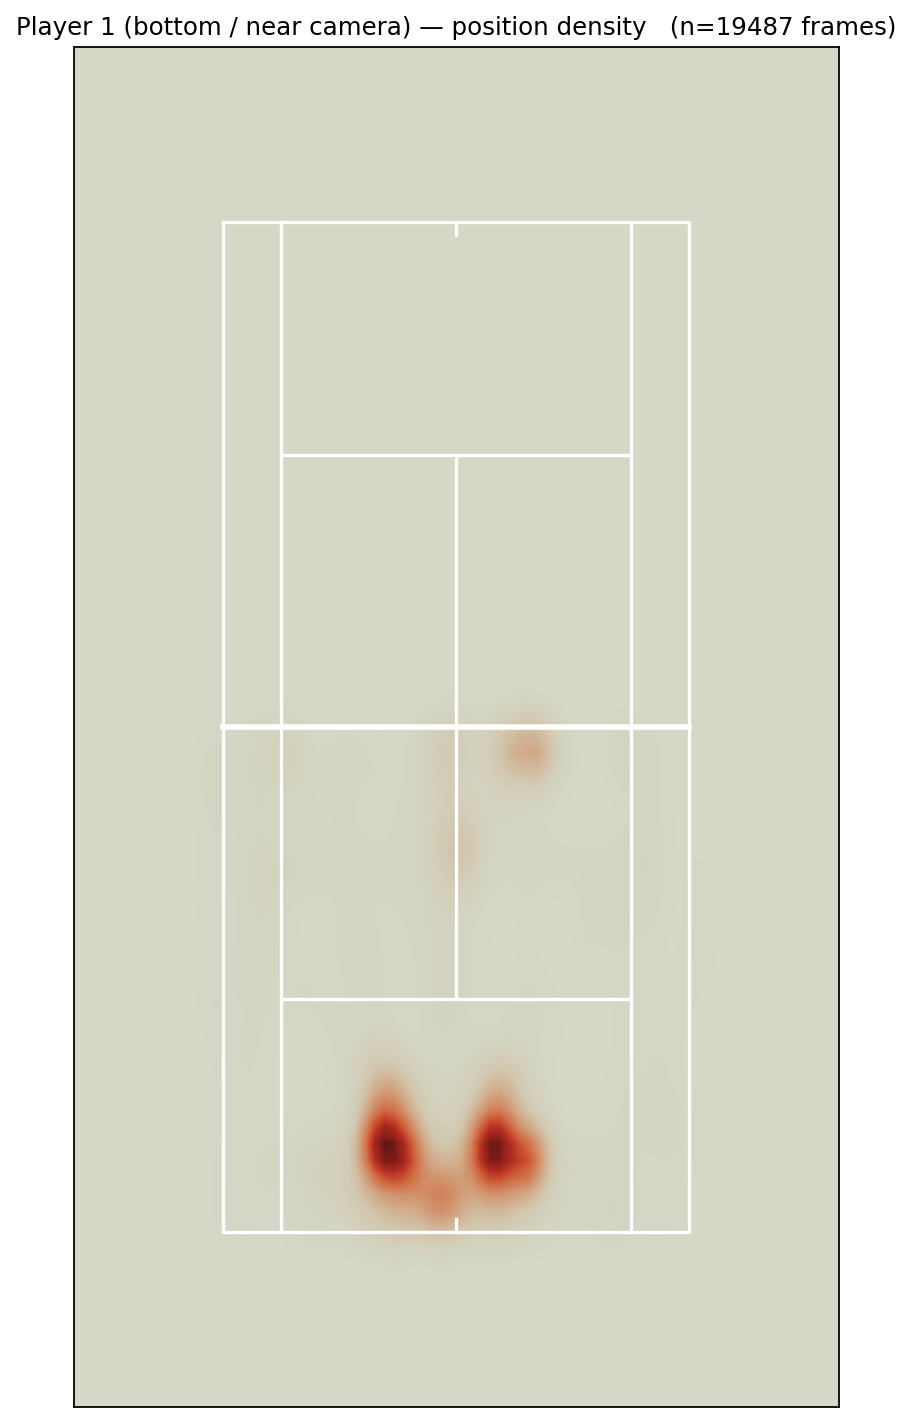
Baseline presence
54.7%
Avg depth
8.29 m
Lateral spread
6.06 m
Coverage
97.7%
🇰🇿
Court topSkatov
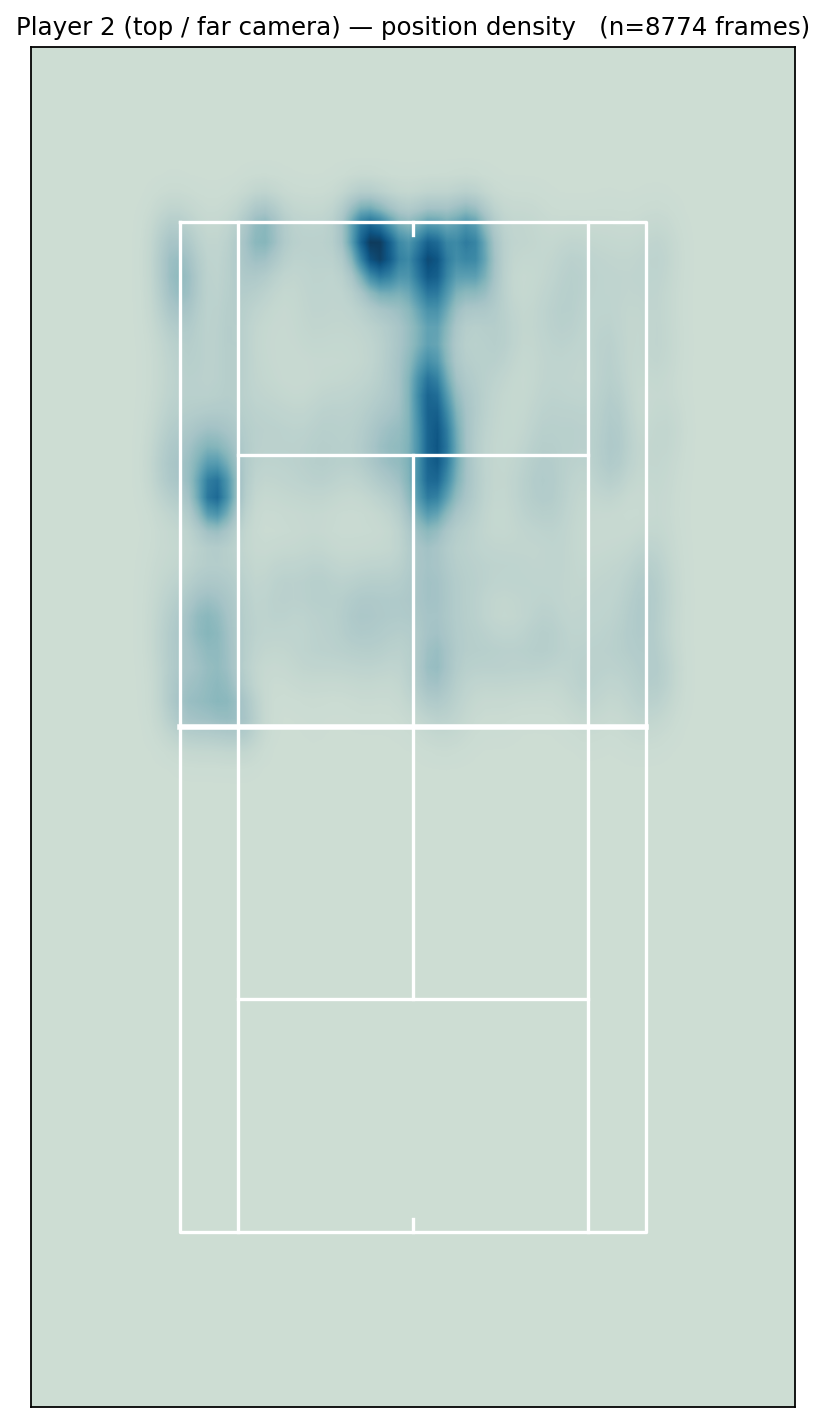
Baseline presence
62.9%
Avg depth
8.93 m
Lateral spread
6.81 m
Coverage
90.7%
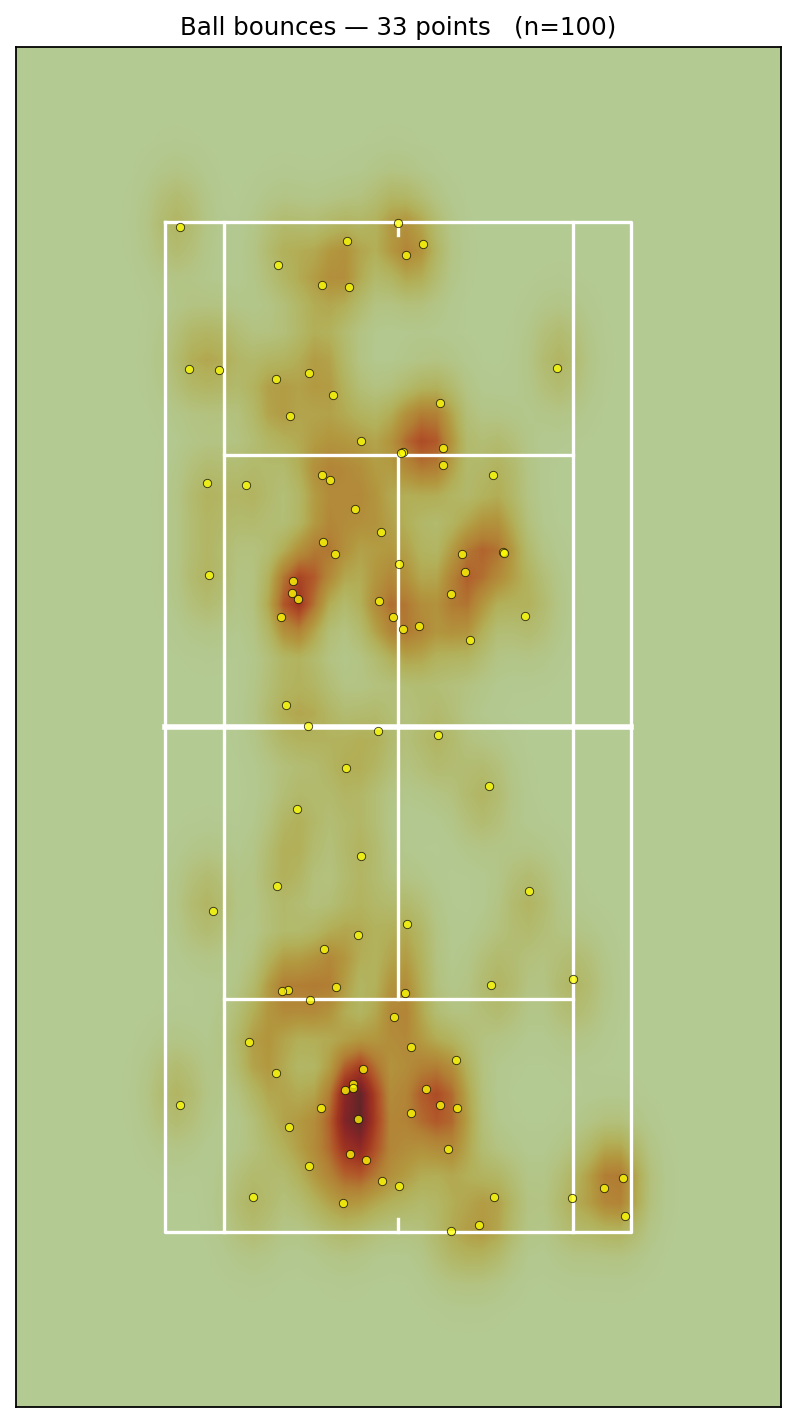
Indicative bounce tendencies, not full ball-tracking truth yet. 138 / 687 bounces retained (20.1% confidence). Ball detected on 57.7% of point-window frames in this broadcast sample.
Real run, no cherry-picking. Numbers below the production target are surfaced explicitly — coach trust comes from honesty about what the model sees and what it misses.